Organic vs. Conventional
Organic fruit has earned itself a place with people being more and more concerned about life quality. Compared with conventionally farm products, organically grown avocado has lower detectable levels of pesticide residue. Yet, the price is higher as well.
The conventional avocado still takes over the market with lower prices, but the share of organic avocado was increasing slightly year by year. 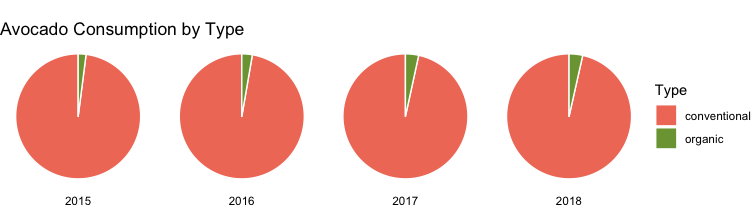
Avocado Price in US over time
We found that across years, the fluctuation of avocado prices was getting greater. Still, a similar pattern could be observed that the prices always peaks around the third quarter of the year. 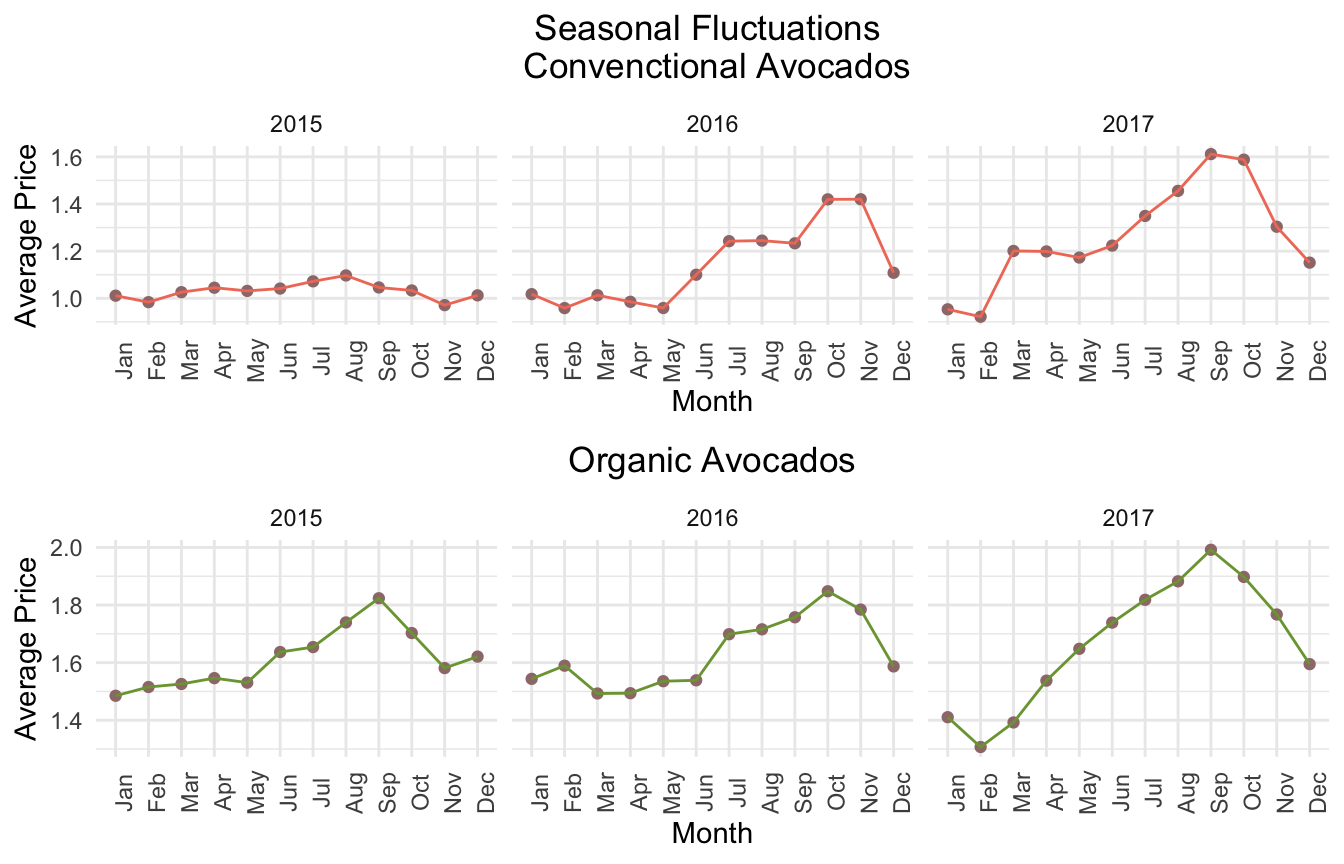
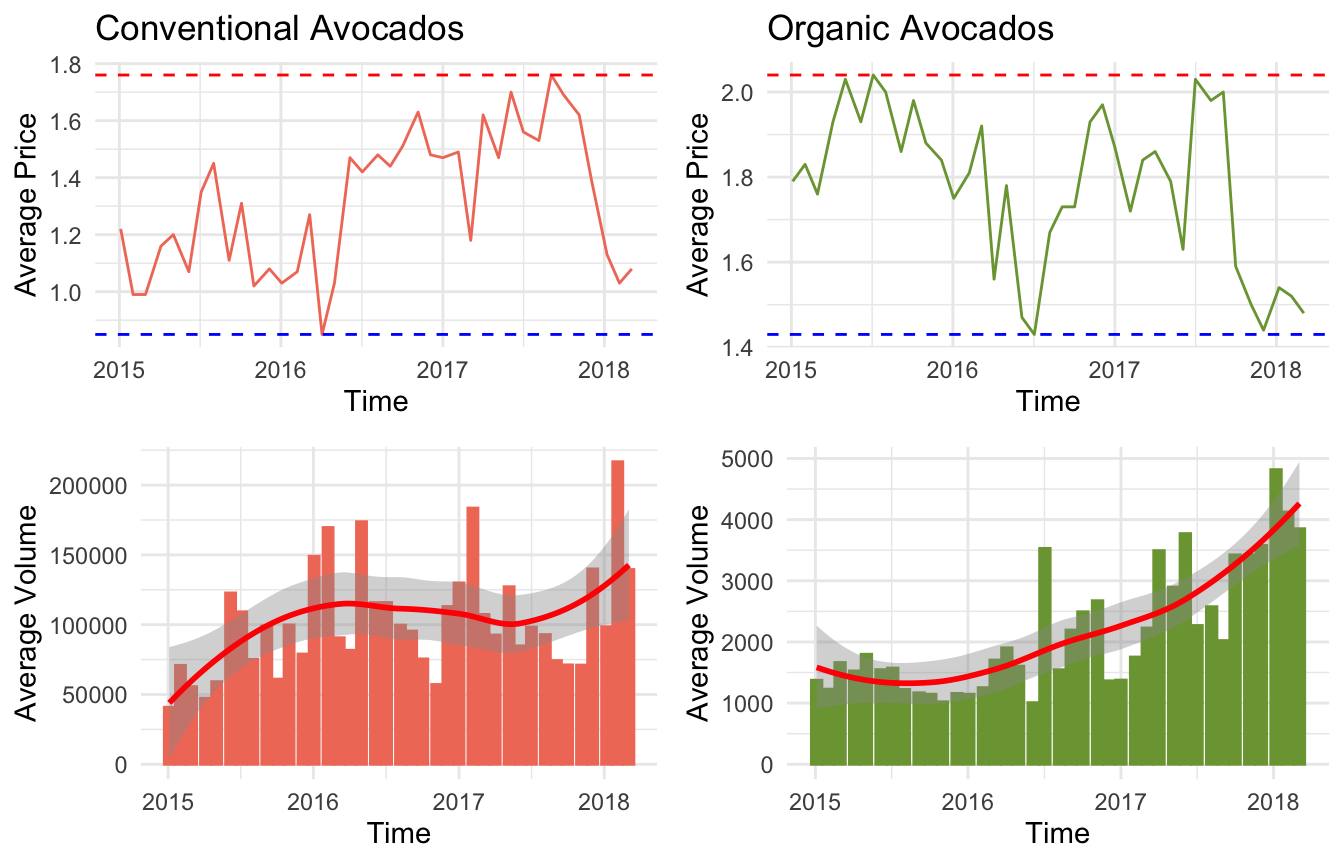
Relationship between Prices and Total Volume
By visualizing both Price vs. Time and Volume vs. Time, we noticed that the volume peak is a signal for an upcoming drop in avocado prices.
Avocado Price across Year in US by Region
We found that the average price among all regions is growing slightly year by year, but the overall price difference remains unchanged among the eight major regions.
Region vs Size
According to the Region vs. Size bar graph, we noticed all eight regions consumed the least extra large avocados. Some regions consumed more large over small ones, and some preferred the small over large ones.
By adding gdp data
We calculated Gdp Per Capita for each region and plotted it against the average price. We found no apparent trend between these two variables. For example, California has the highest GDP per capita, but its average price is around the middle among eight regions.
As for the Region GDP Per Capita vs. Avocado Consumption graph, similarly, we found no apparent trend here as well.
Further inferences on GDP Per Capita are made in the regression analysis section.