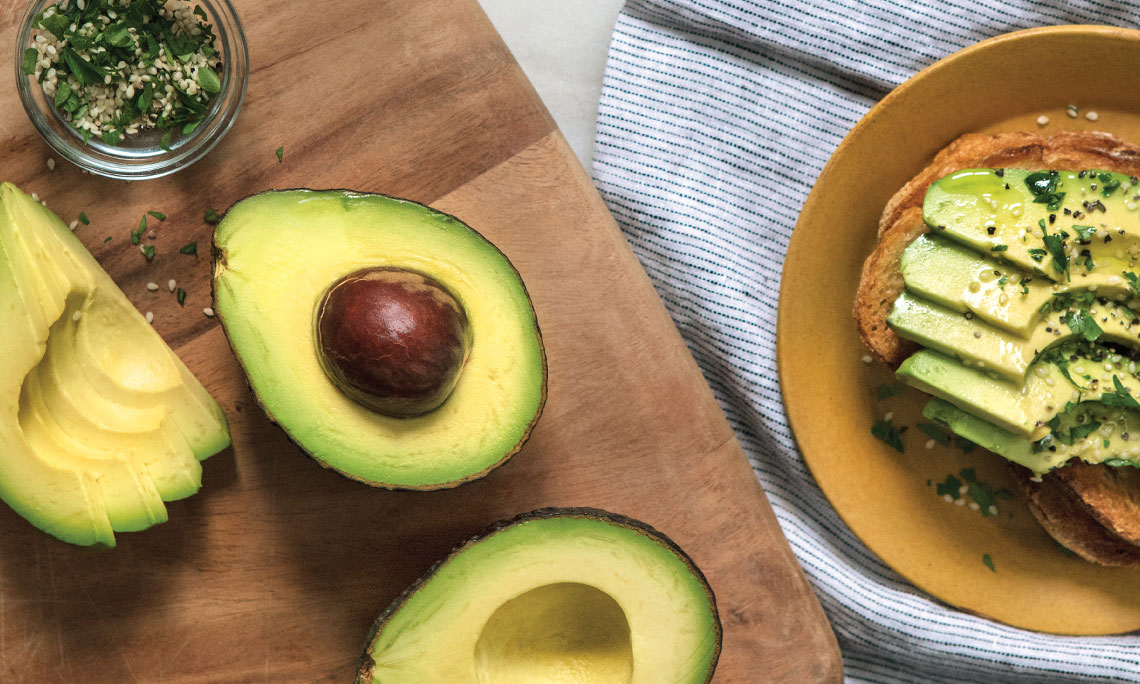
Millennial Avocado Consumption Analysis

Screencast Introduction
Introduction
Avocado has become a more preferable and healthy choice as a source of fat nutrition source. According to USDA, U.S. demand for avocados has increased steadily over the past two decades. Per capita consumption of avocados has tripled since 2001 to 8 pounds per person in 2018. We believe that by looking into influential factors and trends regarding avocado prices, we could gain more insights into its consumption pattern and further predict its impact on people’s life and health.
We want to perform EDA to the original data and implement a prediction model of prices. The impact of GDP on local price and consumption of avocado will also be assessed. We also intend to include interactive visualization tool that will enable people to check on time-base or region-base information purposefully.
Data
Avocado price data: Kaggle- The main avocado dataset, updated till March, 2018, was compiled by Justin Kiggins who obtained the data source from Hass Avocado Board
State GDP data:- The dataset including the annually GDP by the states of the U.S. between 2013 and 2017 can be accessed here
Findings
- Conventional avocado has lower price and higher consumption than organic avocado.
- People from Plains, Midsouth, Great Lakes and Northeast loves large avocado the most while people from Southeast, Southcental, California and West love the samll avocade most.
- Avocado price always peaks around the third quarter of the year.
- The peak of avocado consumption volume is a signal for an upcoming drop in avocado price.
- GDP has little impact on the avocado price.
Report
Our report can be found here.