Regression Analysis
Our main avocado dataset shows the weekly retail volume and average price of Hass avocado, ranging from 2015 to 2018. However, since there is only 11-week data in 2018, we decide to only keep the data between 2015 and 2017.
Trends of average price
For the multiple linear regression analysis, we are interested in the association between the price of avocado and several predictors. We want to firstly get familiar with the trends of average price of a avocado by potential predictors - type, quarter, year, and region.
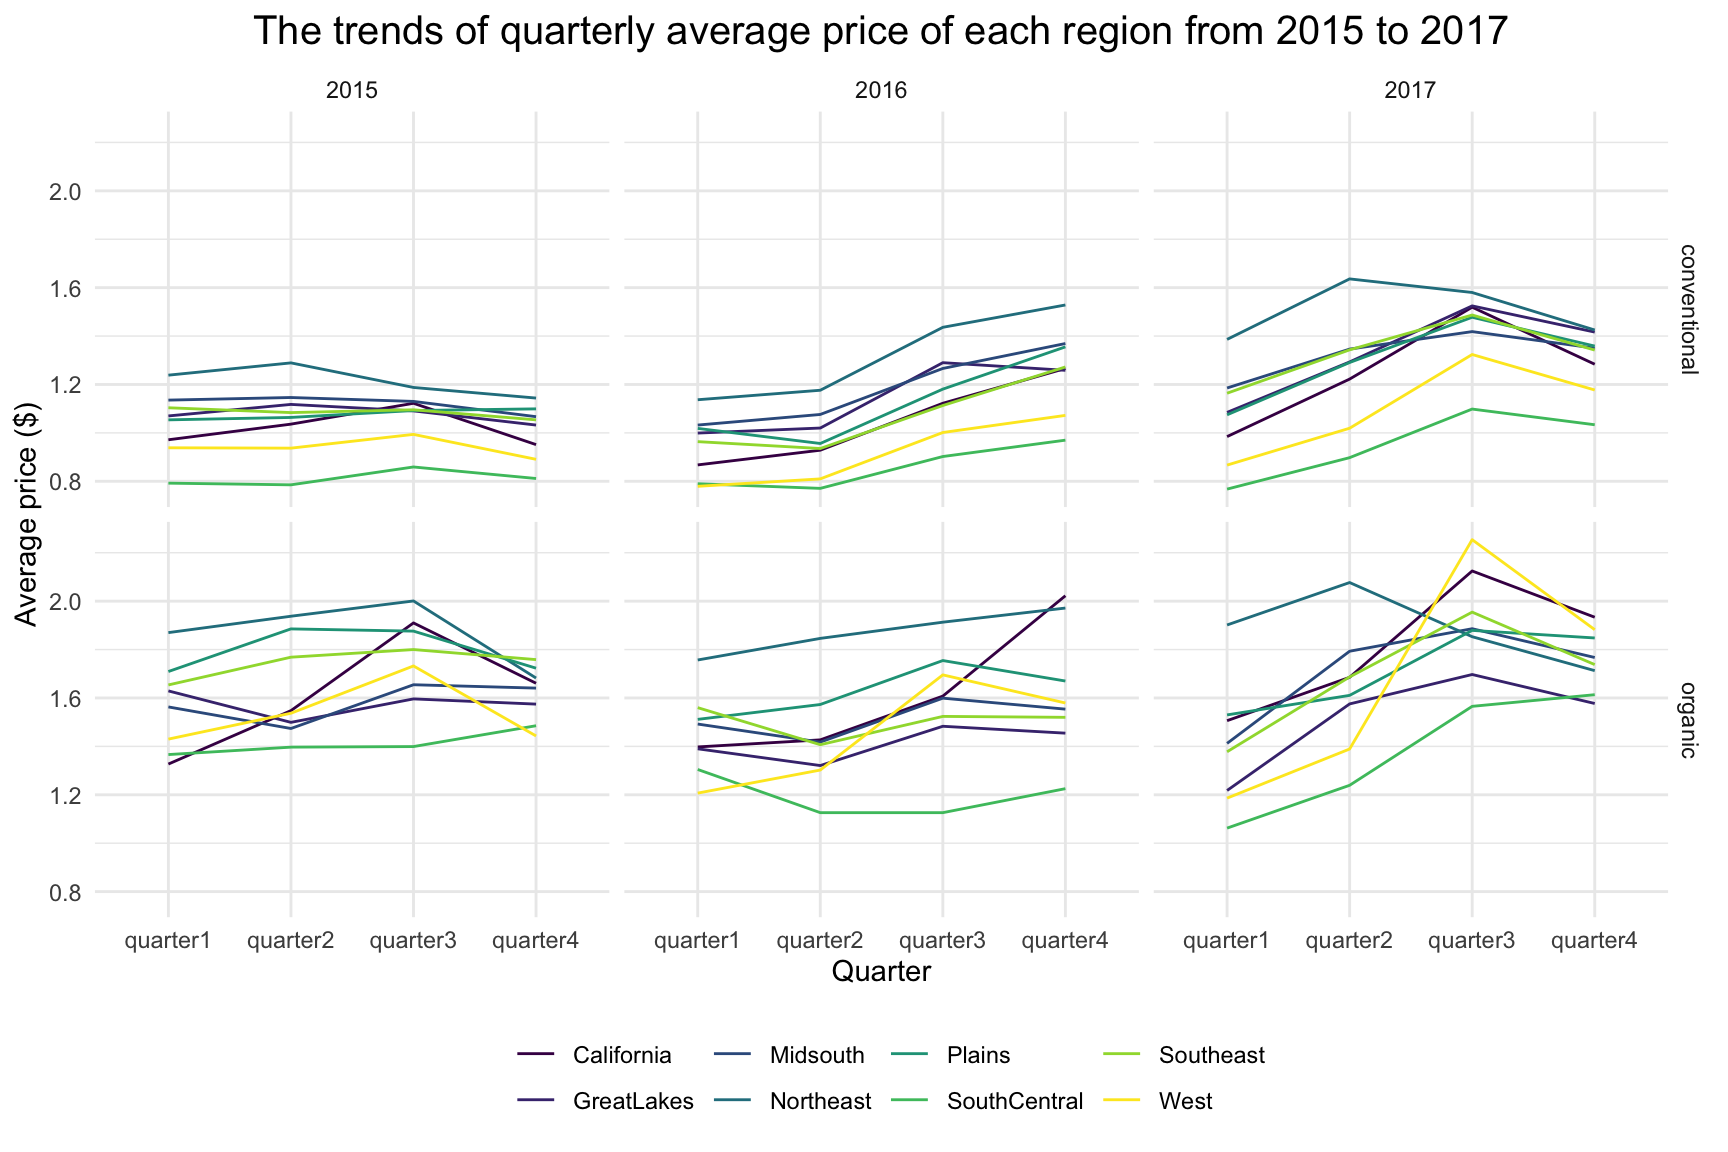 Based on the trends plot, we find that the average price of a avocado is different by the four candidate predictors. Hence, it is reasonable to consider them as predictors in modeling.
MLR modeling
In our designed model, the outcome is
quarterly_average_price: the average price of a single avocado within a quarter of a year
and the predictors considered include:
type: conventional or organic avocado
year: the year of observation
quarter: the quarter of a year. There are four quarters of a year, quarter 1 stands for Jan, Feb, Mar, quarter 2 stands for Apr, May, Jun, quarter 3 stands for Jul, Aug, Sep, quarter 4 stands for Oct, Nov, Dec
region: regions of the observation. There are 8 resgions to be considered, including California, West, Plains, South Central, Great Lakes, Northeast, Midsouth, Southeast. These 8 regions compose 48 states of the U.S., except for Alaska and Hawaii.
The model we intend to fit is:
\[ quarterly \space average \space price = \beta_0 + \beta_1type + \beta_2year + \beta_3quarter + \beta_4 region \]
| term | estimate | p.value |
|---|---|---|
| (Intercept) | -124.9400853 | 0.0000026 |
| Type:organic | 0.4831364 | 0.0000000 |
| year | 0.0624828 | 0.0000022 |
| Quarter: quarter2 | 0.0820032 | 0.0059938 |
| Quarter: quarter3 | 0.2381571 | 0.0000000 |
| Quarter: quarter4 | 0.1833036 | 0.0000000 |
| Region:GreatLakes | -0.0505655 | 0.2268371 |
| Region:Midsouth | 0.0146154 | 0.7263595 |
| Region:Northeast | 0.2192285 | 0.0000004 |
| Region:Plains | 0.0486241 | 0.2451037 |
| Region:SouthCentral | -0.2931731 | 0.0000000 |
| Region:Southeast | 0.0116896 | 0.7795317 |
| Region:West | -0.1240774 | 0.0033267 |
Based on the results of the multiple linear regression, the effect of organic type is significant with reference on conventional type due to a negligible p-value. And the organic type has a relatively large positive estimate value, indicating changes in the organic type variable are associated with positive changes in the response of quarterly average price at the population level.
Since the average price of avocado is increasing with increased year based on the previous trend plot, we consider the year as a continuous variable. And the effect of year is significant with a p-value smaller than 0.05.
The effect of quarter is also significant with p-value below 0.05 based on the reference on quarter 1, and there are increasing estimates from quarter 2 to quarter 4.
With reference on California, the effect of region is only significant for Northeast, South Central, and West. Northeast has a higher positive estimate, indicating a significantly greater influence on quarterly average price by Northeast. The estimates of South Central and West are negative, indicating a significantly negative influence on the outcome by these two regions. For the other four regions including Great Lakes, Midsouth, Plains, and Southeast, their p-value is above 0.05, indicating their average prices of a quarter are not significantly different from that of California. It is also confirmed from the previous plot that the trends of these four regions are close to that of California.
The F test statistics of the model is 18.62264 with a p-value below 0.05, indicating the model is significant. The R2 of 0.8193877 is fairly good, accounting for 82% of variation in the response that is explained by the model.
Regression diagnostics
To check whether our model meets the assumptions of the analysis, regression diagnostic plots are created: 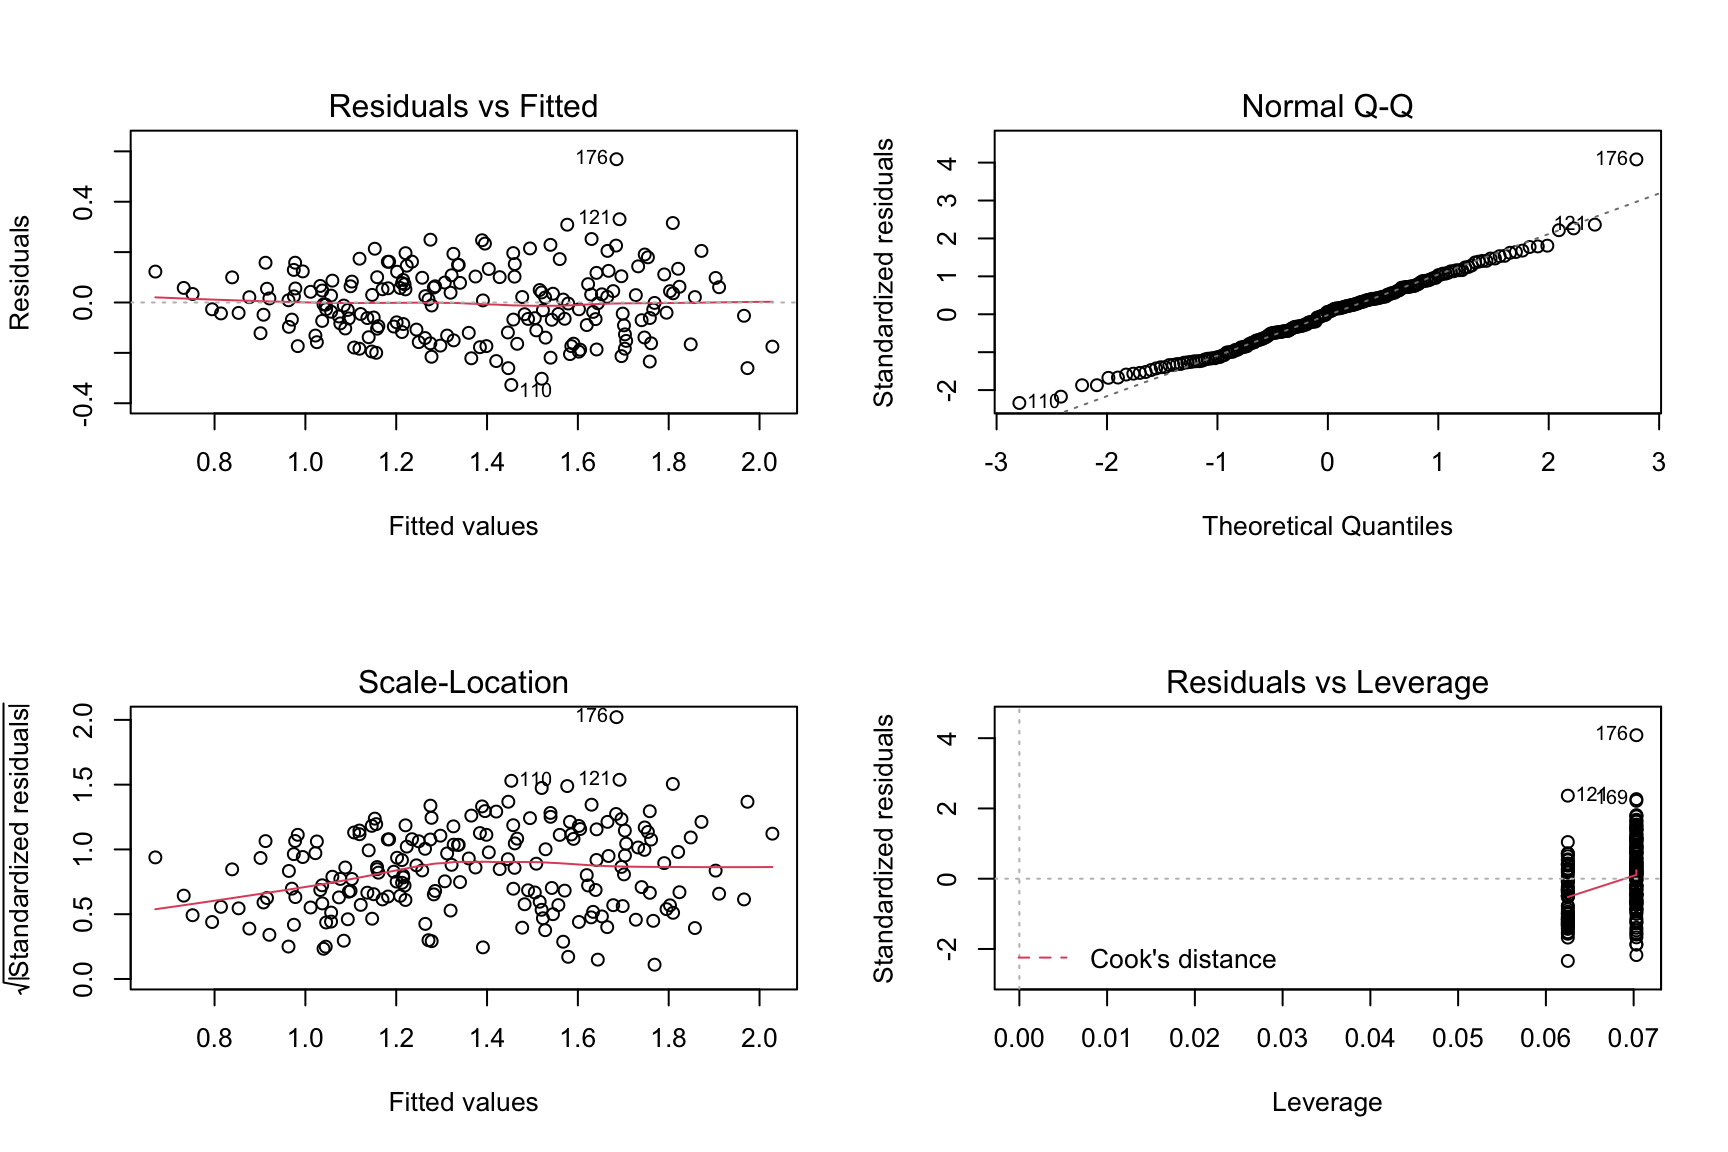 In the Residuals vs Fitted plot, the red line showing the average value of the residuals at each value of fitted value is pretty flat, and points appear to be randomly spread out about the line, indicating no concerning non-linear trends or changes in variability. The normal QQ plot is also good where the residuals match to the diagonal line, indicating these residuals look to be normally distributed. In the leverage plot, there is no evidence of outliers due to the absence of Cook’ distance dashed line. Generally, the assumptions are all satisfied and our model is valid.
How about GDP per capita as another predictor?
We want to test whether GDP per capita would influence the response of the average price of avocado. Since we only have the annually GDP by the 8 regions of the U.S., we decide to consider annually average price of a avocado as the outcome and remove quarter variable from the previous model. Our new null model is: \[ annually \space average \space price = \beta_0 + \beta_1type + \beta_2year + \beta_3 region \]
The alternative model with additional GDP per capita variable is : \[ annually \space average \space price = \beta_0 + \beta_1type + \beta_2year + \beta_3 region +\beta_4 gdp \space per \space capita \]
The partial F-test for nested models is performed through ANOVA to compare the small and large models. In addition, cross validation is visualized to show the value of root-mean-squared error (RMSE). The results are shown below:
| Res.Df | RSS | Df | Sum of Sq | F | Pr(>F) |
|---|---|---|---|---|---|
| 38 | 0.3570618 | NA | NA | NA | NA |
| 37 | 0.3292426 | 1 | 0.0278192 | 3.126302 | 0.0852837 |
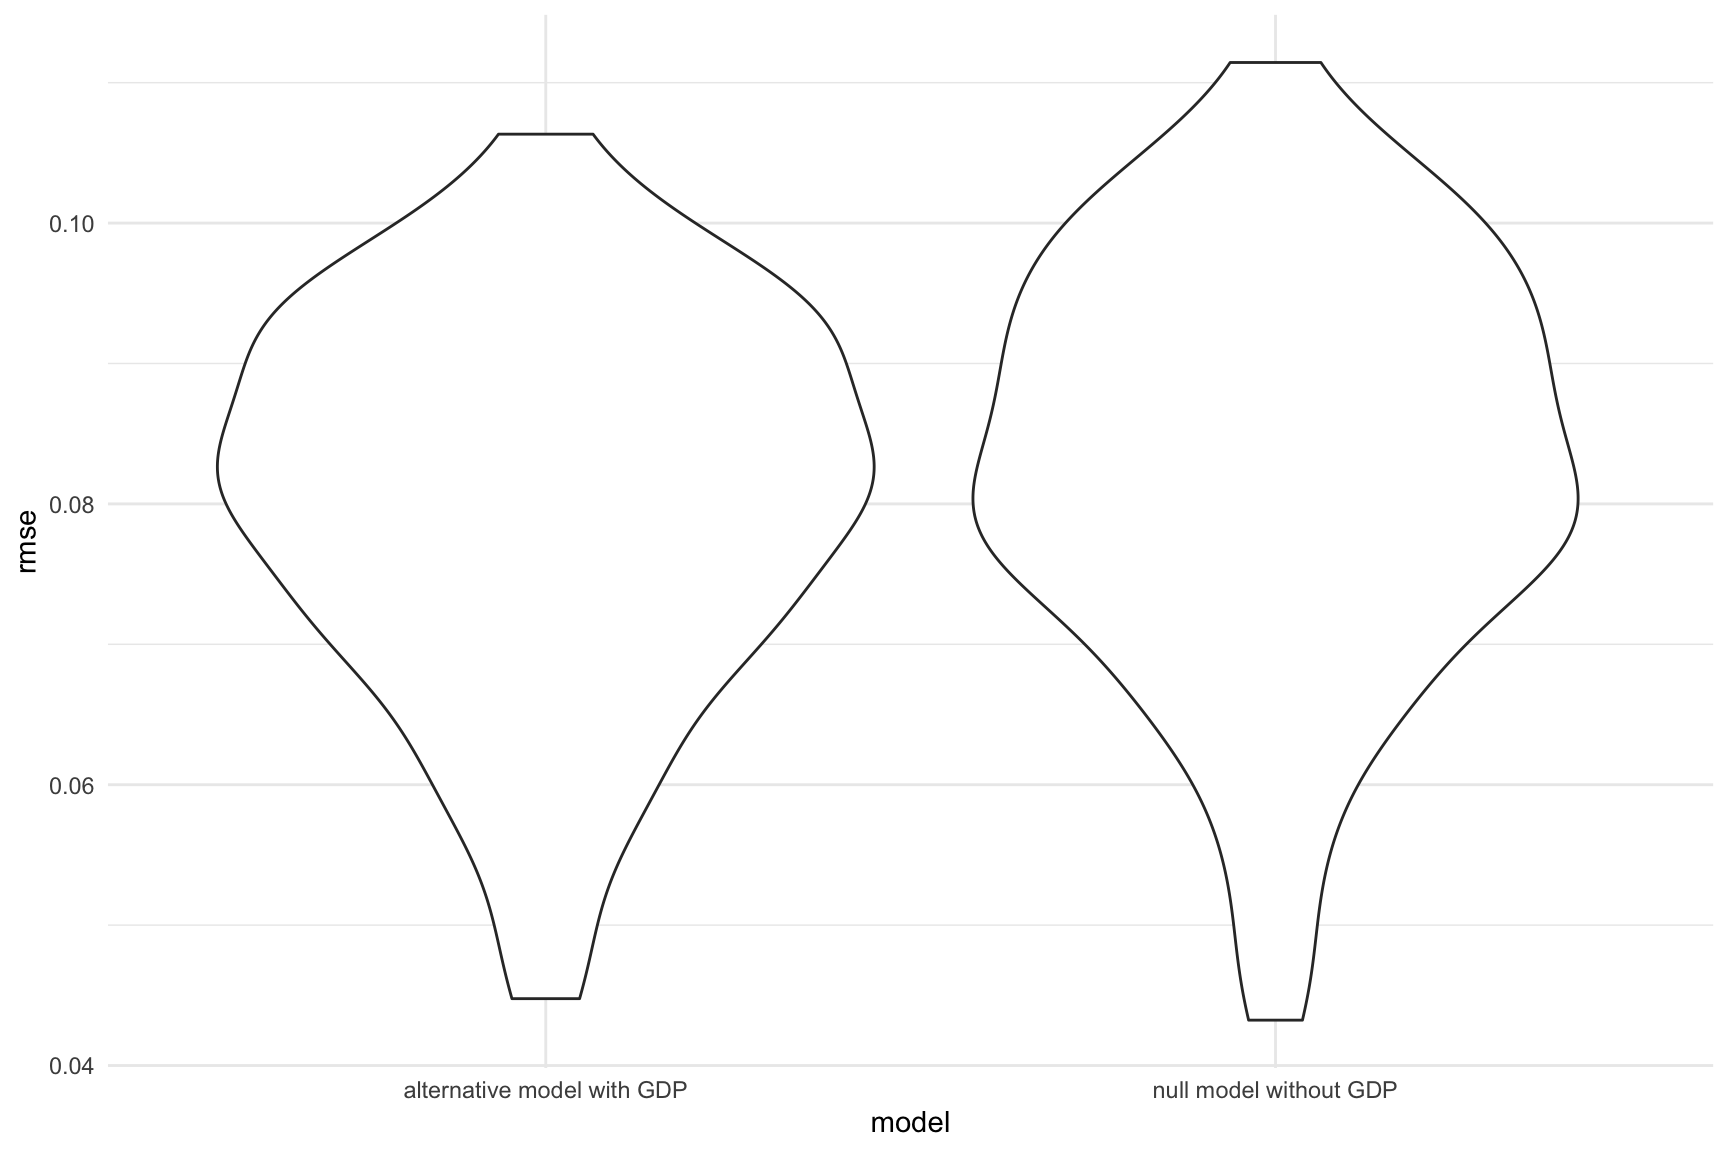
Although the p-value of 0.085 is small, it is higher than 0.05. Hence, with a significance level of 0.05, We fail to reject the small model without the GDP per capita predictor. Given type, year, region predictors in the model, the partial R2 of the GDP per capita predictor is 0.08, which means the marginal contribution of GDP per capita to the variation in the annually average price of a avocado is only 8%. Based on the cross validation, the prediction error distributions of the two models are similar. Hence, we conclude that GDP per capita is not a significant predictor of the annually average price of a avocado. Future study of the price of avocado should be better consider the other potential predictors.