EDA
Preview the cleaned avocado dataset.
| year | month | day | average_price | total_volume | small | large | extra_large | type | region |
|---|---|---|---|---|---|---|---|---|---|
| 2015 | 12 | 27 | 1.33 | 64236.62 | 1036.74 | 54454.85 | 48.16 | conventional | Albany |
| 2015 | 12 | 20 | 1.35 | 54876.98 | 674.28 | 44638.81 | 58.33 | conventional | Albany |
| 2015 | 12 | 13 | 0.93 | 118220.22 | 794.70 | 109149.67 | 130.50 | conventional | Albany |
| 2015 | 12 | 6 | 1.08 | 78992.15 | 1132.00 | 71976.41 | 72.58 | conventional | Albany |
| 2015 | 11 | 29 | 1.28 | 51039.60 | 941.48 | 43838.39 | 75.78 | conventional | Albany |
| 2015 | 11 | 22 | 1.26 | 55979.78 | 1184.27 | 48067.99 | 43.61 | conventional | Albany |
Preview the gdp dataset.
| Area | 2013 | 2014 | 2015 | 2016 | 2017 |
|---|---|---|---|---|---|
| United States | 48534 | 49329 | 50301 | 50660 | 51337 |
| Alabama | 36674 | 36473 | 36818 | 37158 | 37508 |
| Alaska | 69711 | 67179 | 65971 | 63304 | 63610 |
| Arizona | 38352 | 38534 | 38787 | 38940 | 39583 |
| Arkansas | 35888 | 36265 | 36295 | 36502 | 36714 |
| California | 53838 | 55571 | 57637 | 58974 | 60359 |
Avocado dataset
Checking the Distribution of the avocado price, we found that the prices of the two types of avocado, conventional and organic, are generally normally distributed, with organic avocado prices being much higher. 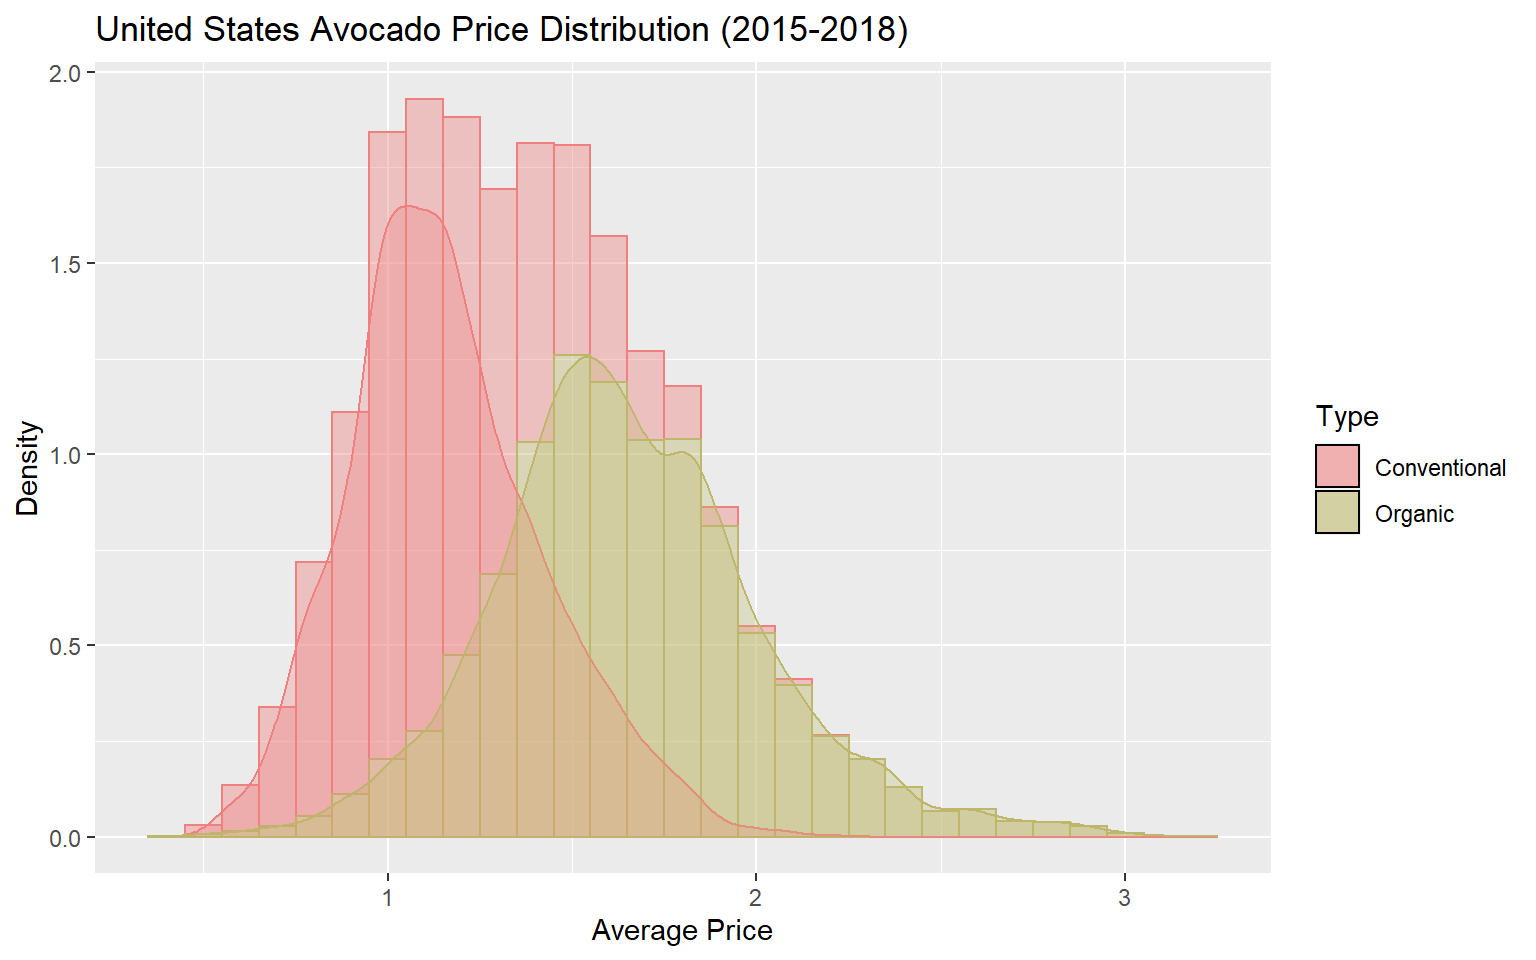
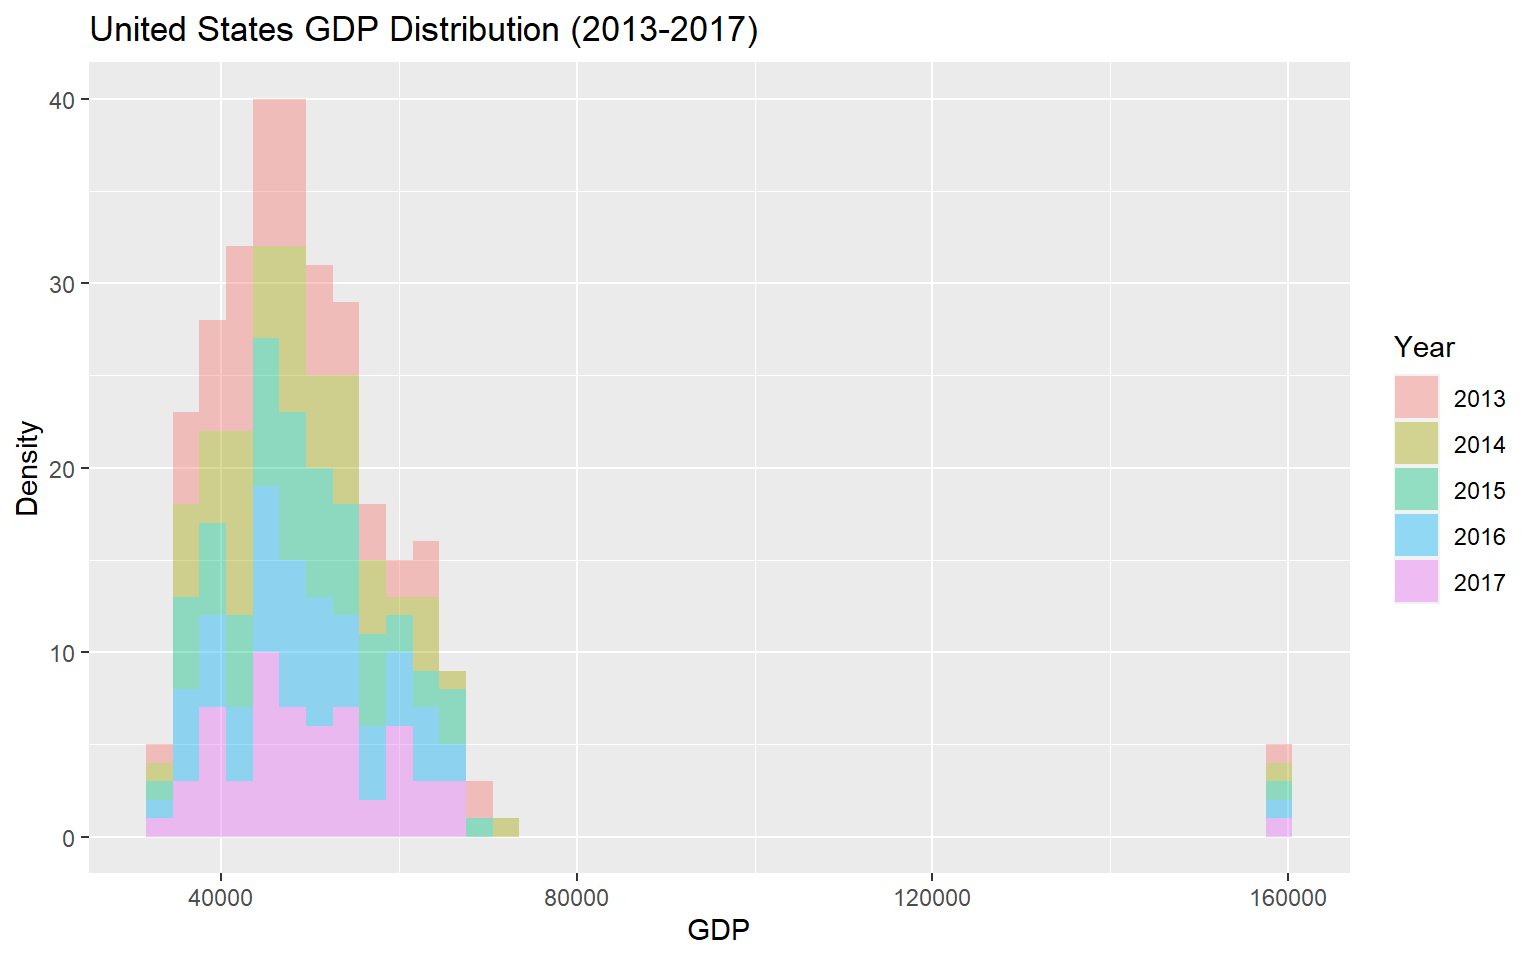
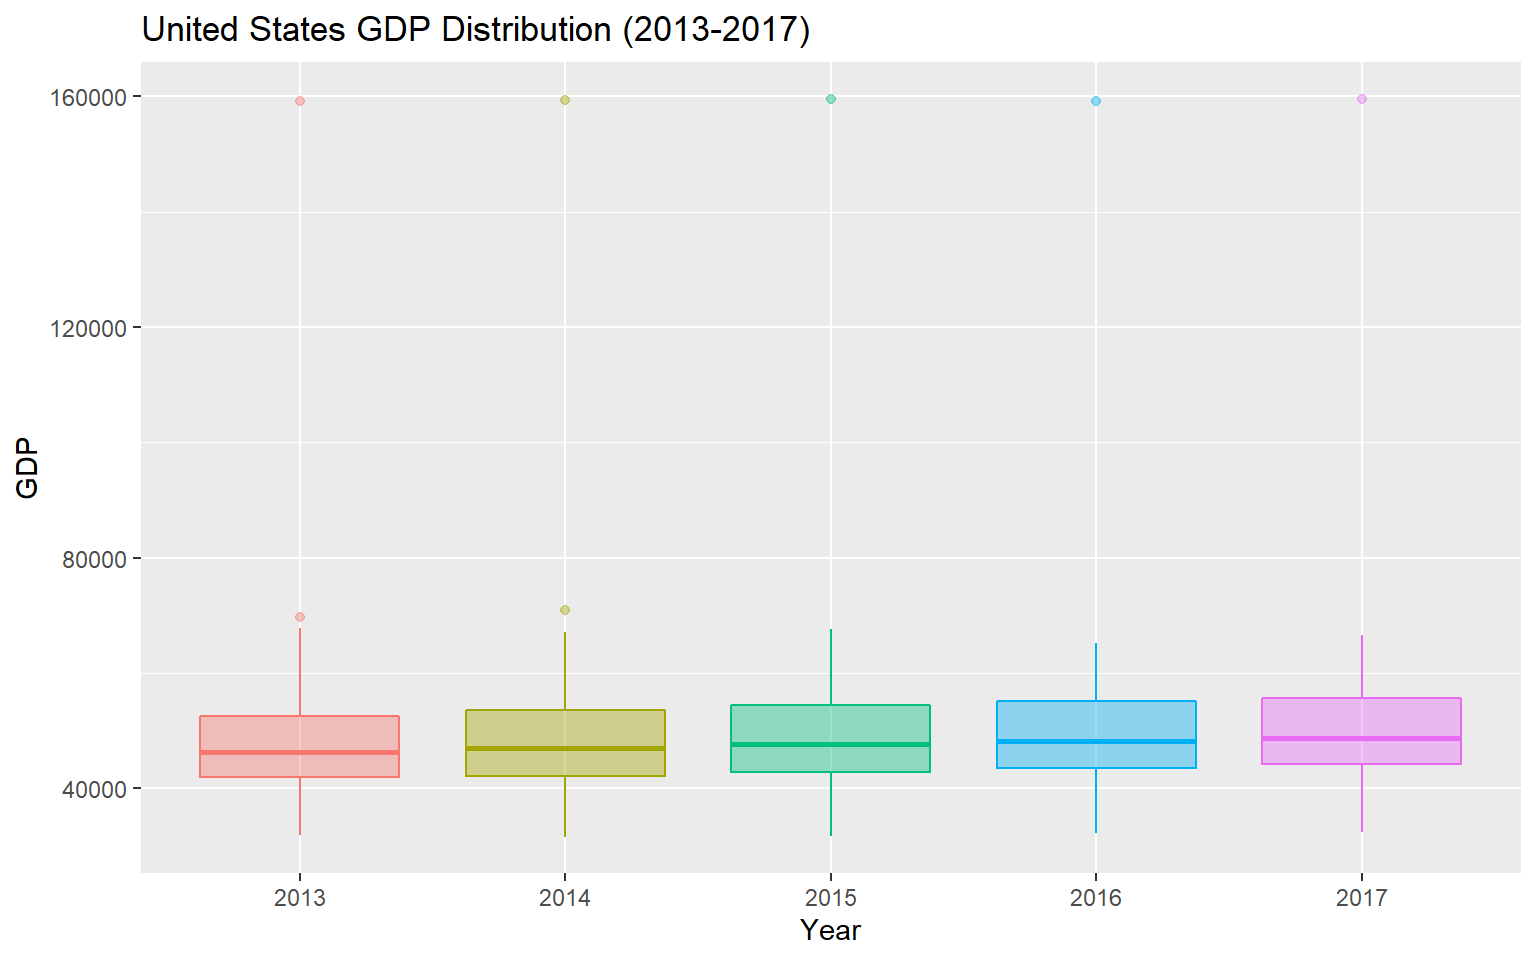
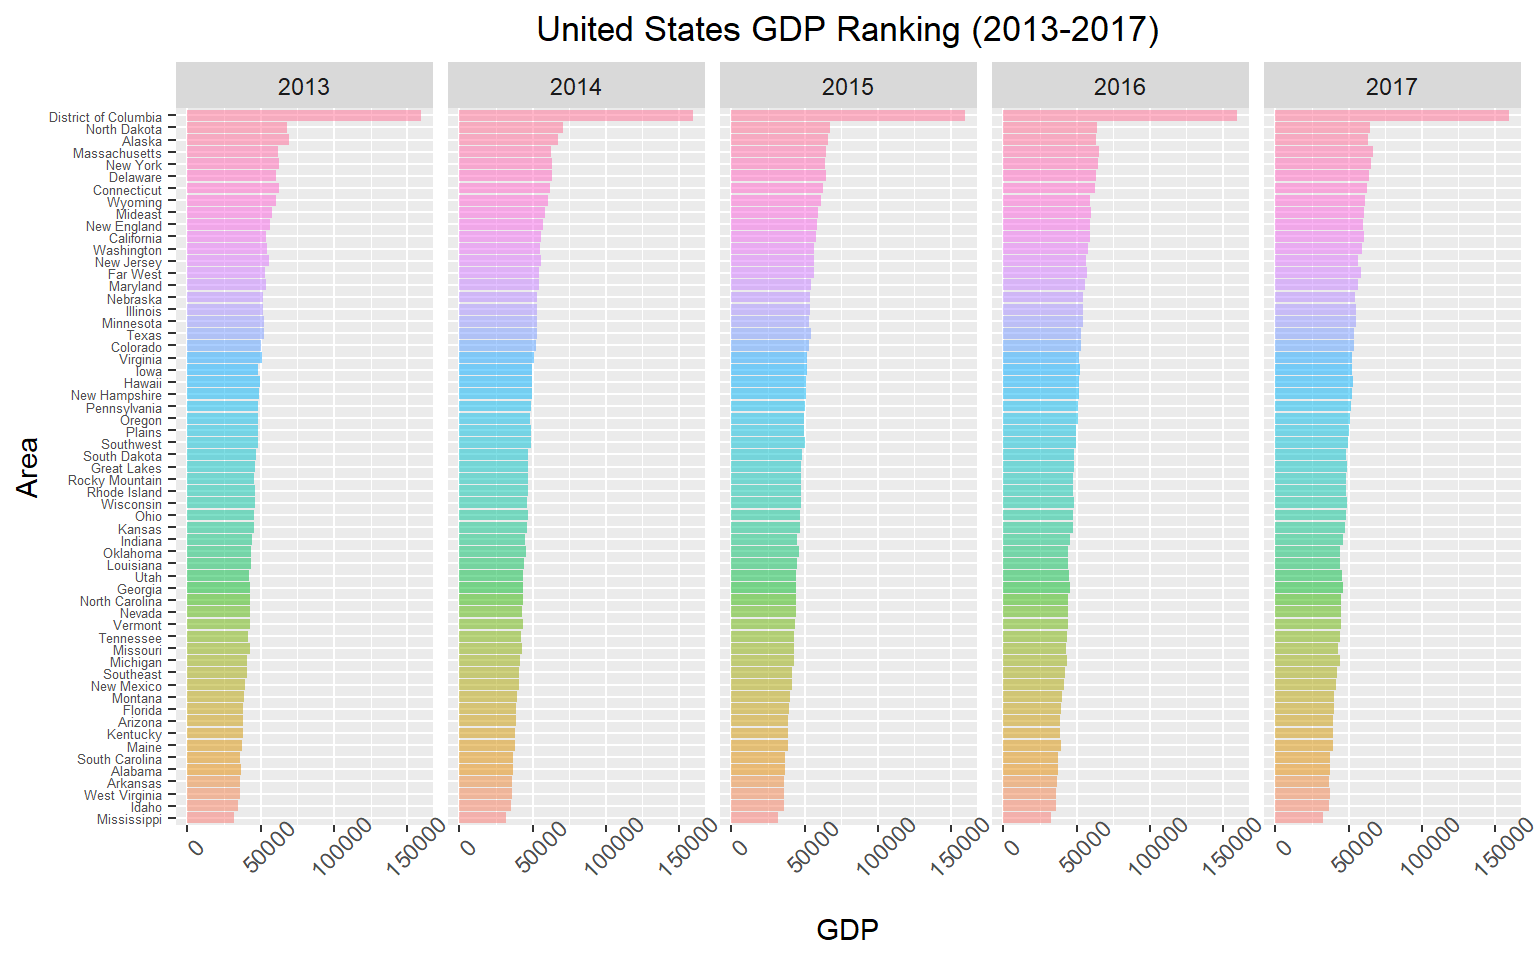
GDP dataset
Preview the GDP distribution.